Back to all startups

ToDiagram

transforms data to interactive diagrams

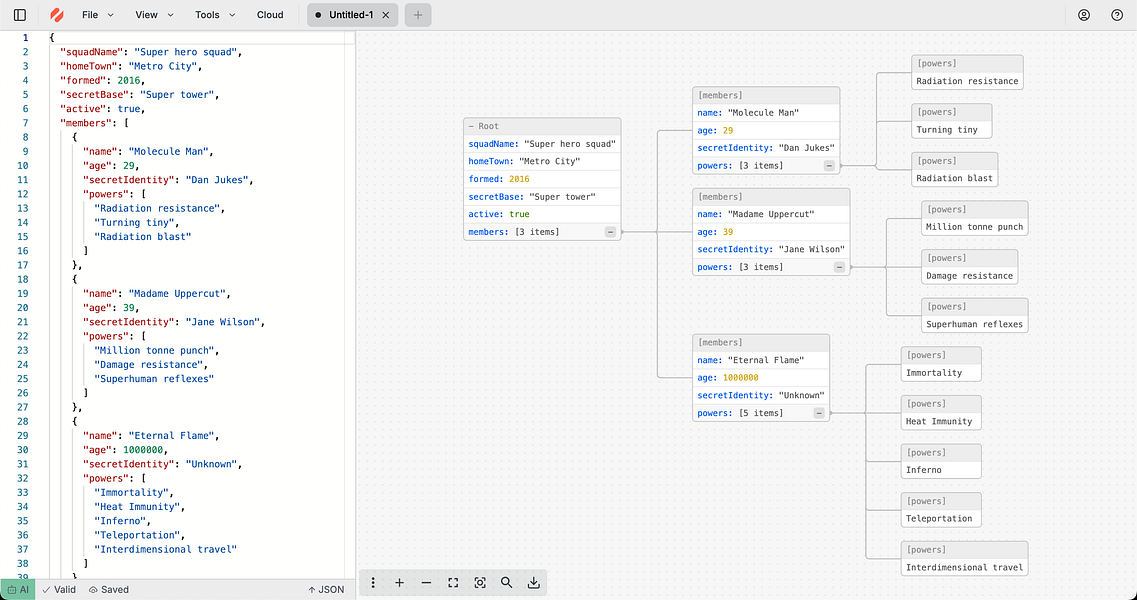
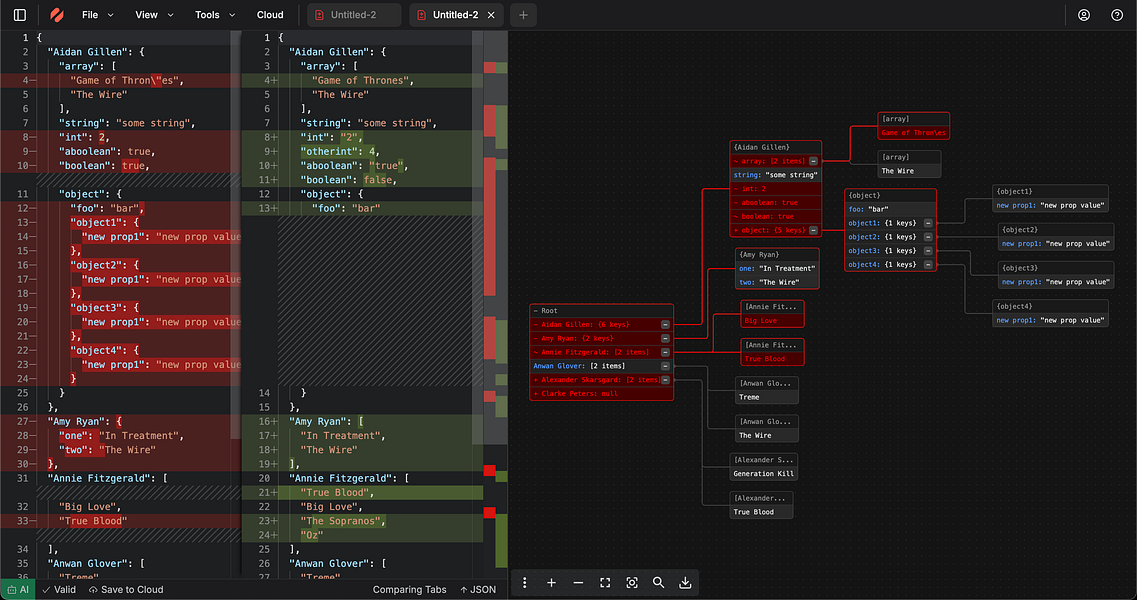
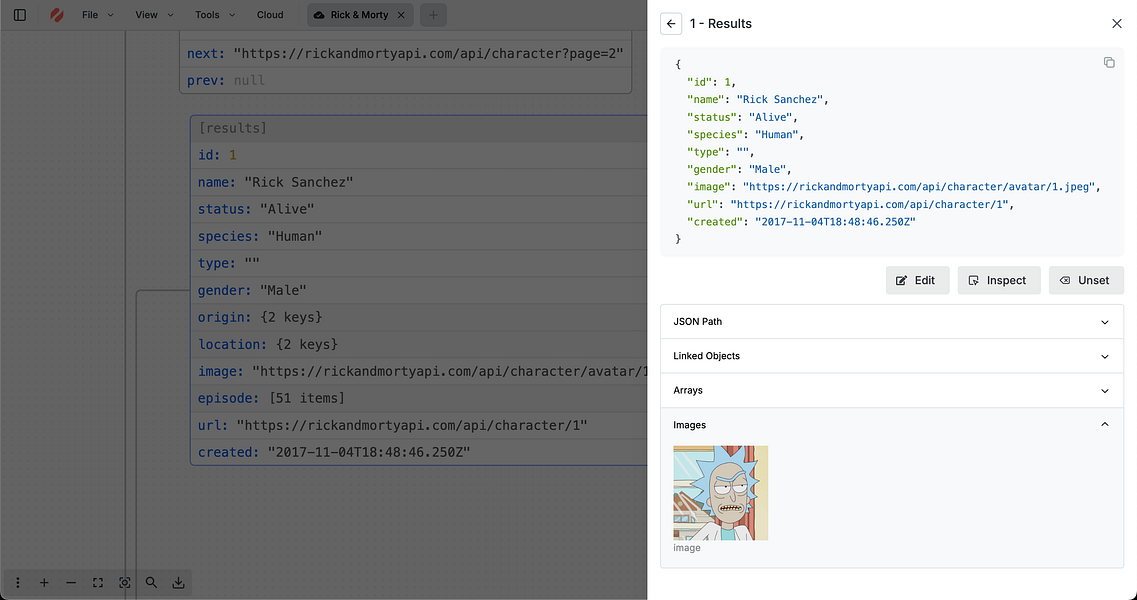
ToDiagram is a tool that turns JSON, YAML, and similar data into diagrams you can edit. Instead of digging through text, you can see your data as a visual structure and make changes directly.

It comes with tools to validate, format, convert, and query your data. Whether you’re generating a JSON Schema, running a jq query, or just trying to understand a complex dataset, ToDiagram makes the process faster and easier.

Discover startups similar to ToDiagram

Chartle Create shareable charts from natural language or data
temprl.pro Structure Your Unstructred Data with clicks
PaioClaw BOOSTED Pre-built Claws on OpenClaw. Secure. Live in 60 seconds.
Columns Connect data, auto-clean it, and share live, brand-ready visuals
Modellot Map, document, and govern your data for EU Data Act compliance
StatPecker Ask questions and turn data into credible, ready-to-share visuals
Hi-AI BOOSTED Affordable AI videos, music, voice, images, 3D, search, news, and reports
Nodask Don’t list it. Map it. Visual task flow that actually makes sense