
The Excel Dashboard Toolkit
Easily leverage all of Excel's powerful design and visualization features
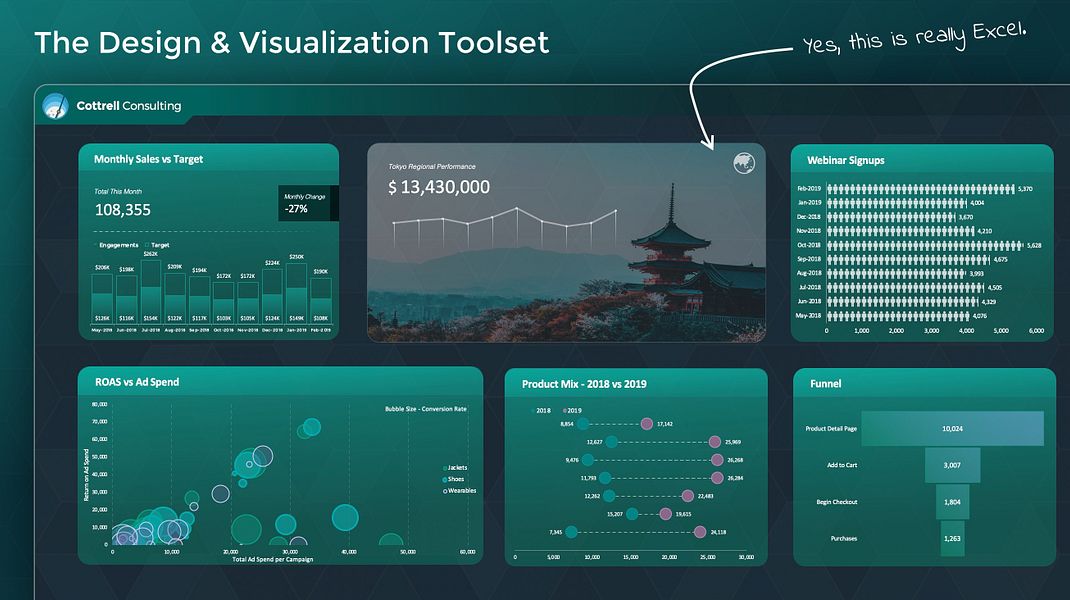
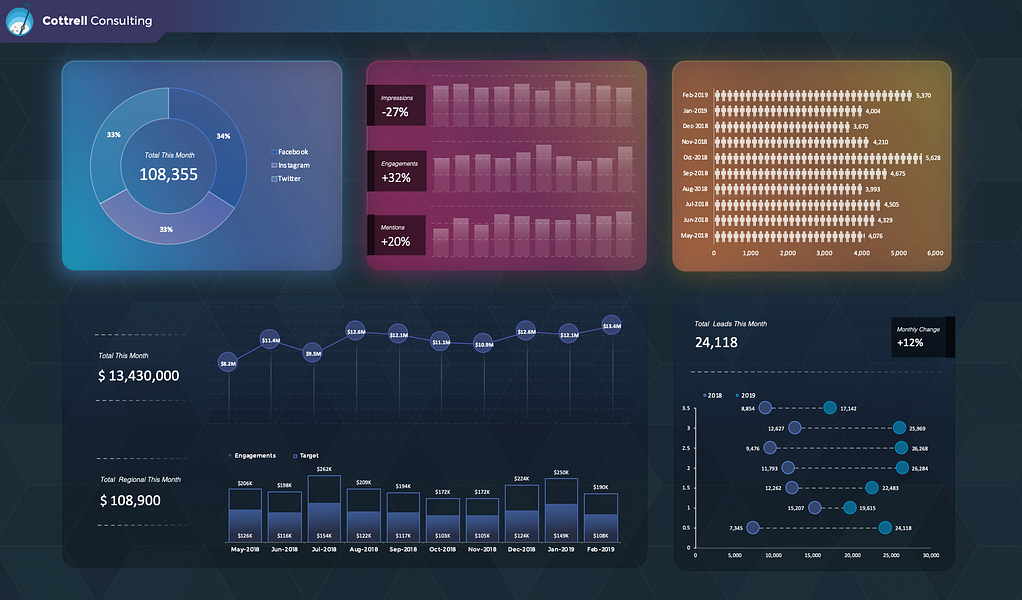

The Excel Dashboard Toolkit is the quickest and easiest way to make Excel look less like... Excel. I've been using Excel for years and noticed that almost all of my coworkers and clients were not aware of the visual design and data visualization features it had available. They're fairly easy to learn and none of it requires any plugins or fancy coding. I built this toolkit so that everyone could have copy-pasteable components they can customize/deconstruct. I've found that this is the easiest way to learn how these features work.
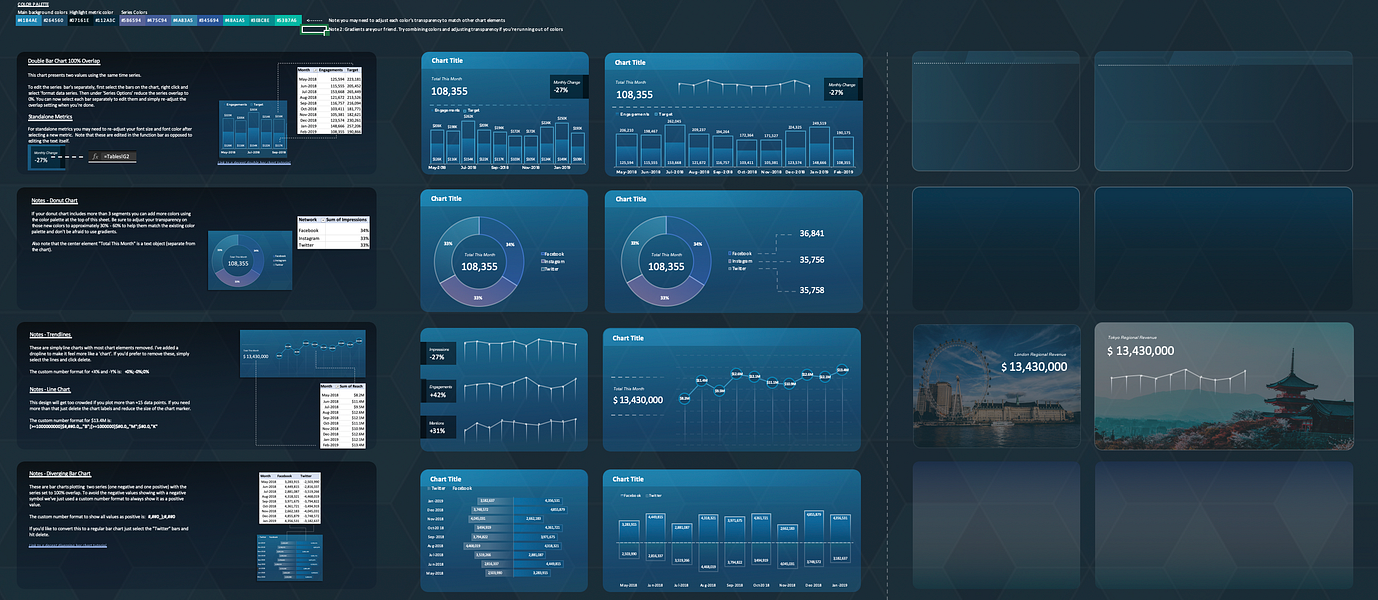
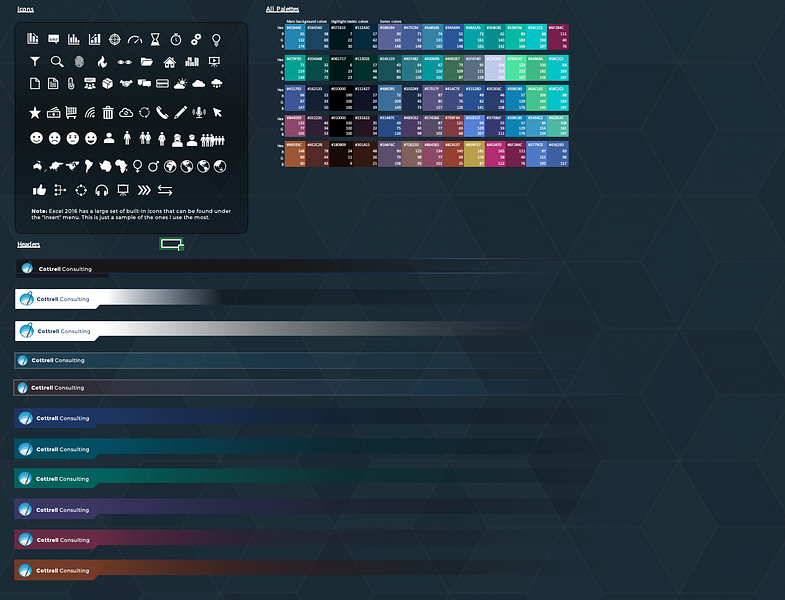
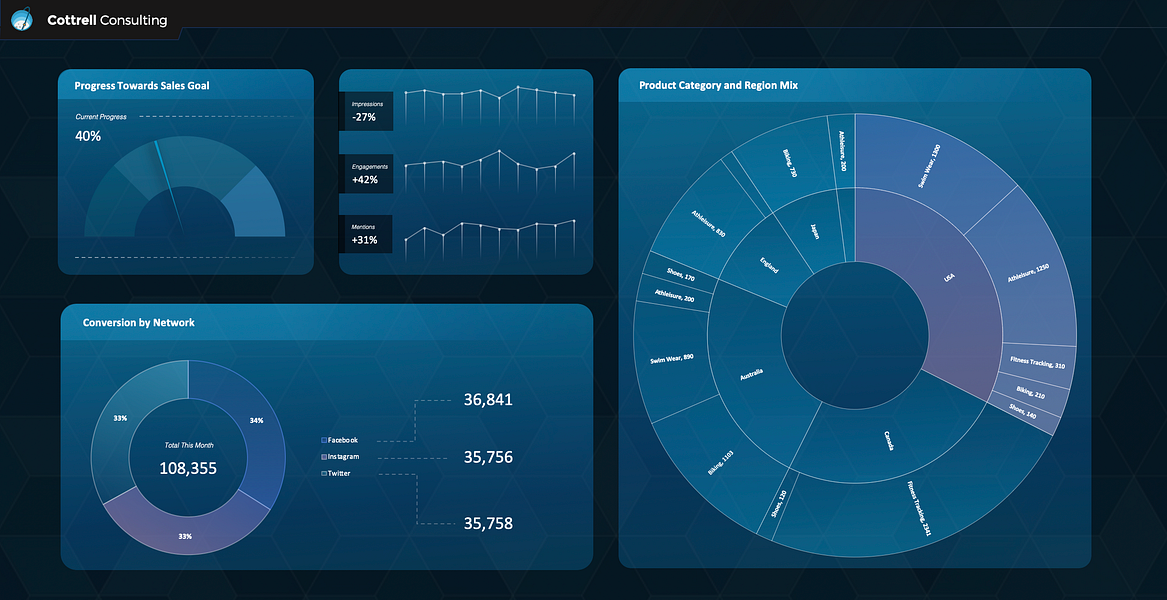
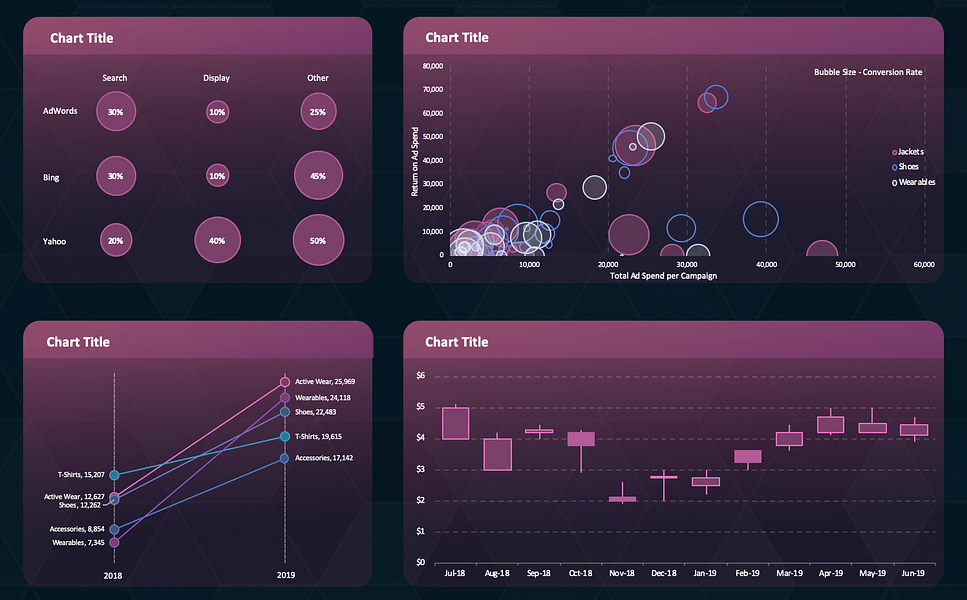
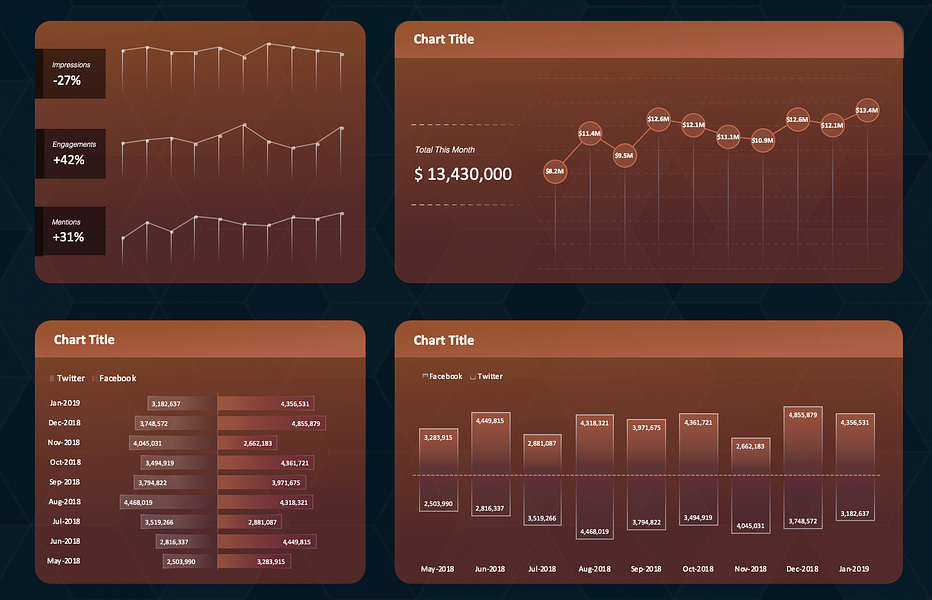
So what's in the file? - 125 charts (25 chart types in 5 different color palettes) - 10+ different shape styles - 3 sample dashboards - Tips, tricks & more