
inapptics
Mobile app analytics with visual flows, heat maps and crash recordings
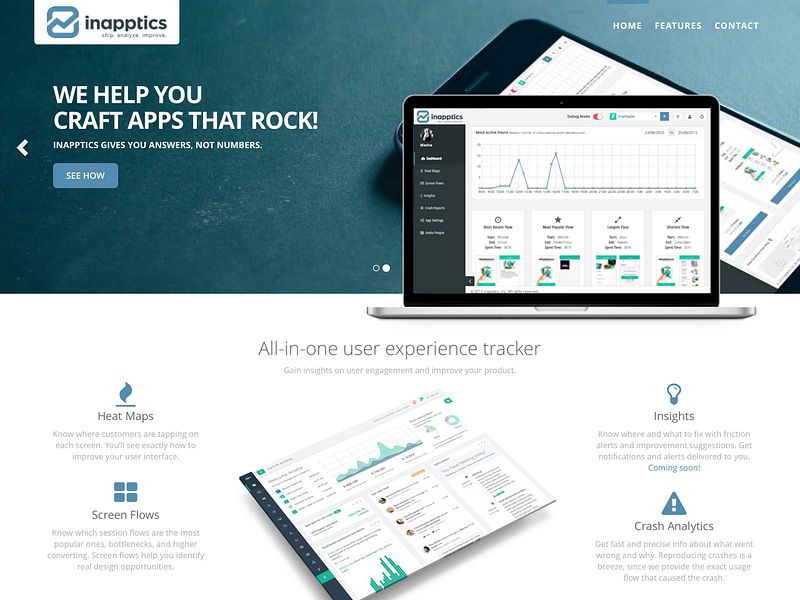
Inapptics helps developers and UI/UX designers build better mobile apps by understanding how their app is being used. Currently that includes capturing and presenting visual flows, heat maps and crash recordings.
Use inapptics to see which session flows are most popular, bottlenecks and higher converting. Know where users are tapping on each screen. Reproducing crashes is a breeze, since inapptics provides the exact usage flow that caused the crash.
More like inapptics
Startups doing something similar, featured in the last two years


Google Analytics Alternative with Heatmaps, Session Recordings and more

Screen recorder for stunning product demo videos


Build and ship mobile apps in minutes, by talking to your phone

Go from monitoring to executive strategic reports in seconds

Cookie-free analytics that tracks user actions as a timeline


Showcase what you love with beautiful pages on your phone

Run no-code pricing and conversion experiments tied to revenue

Get structured market analysis reports in minutes

Minimal analytics with no cookies or clutter