AddGraph
Flowchart and data visualization tools
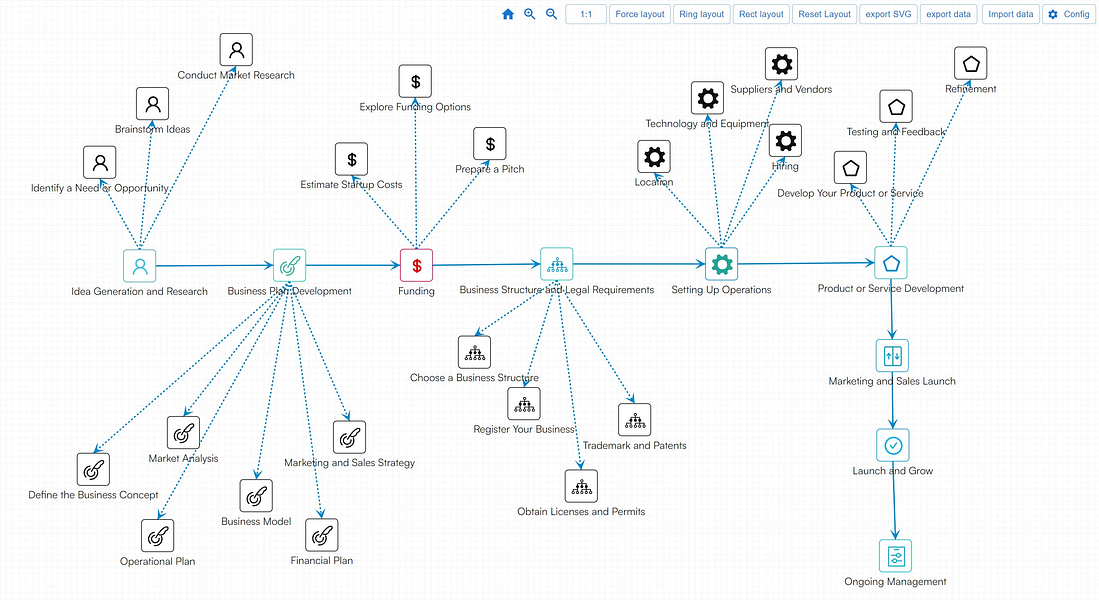
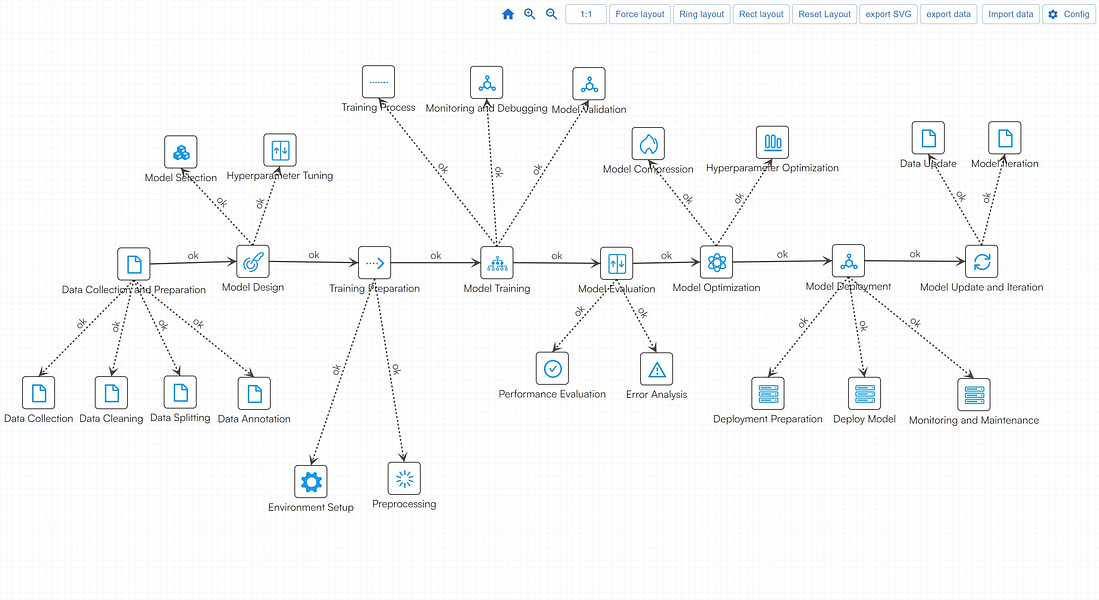
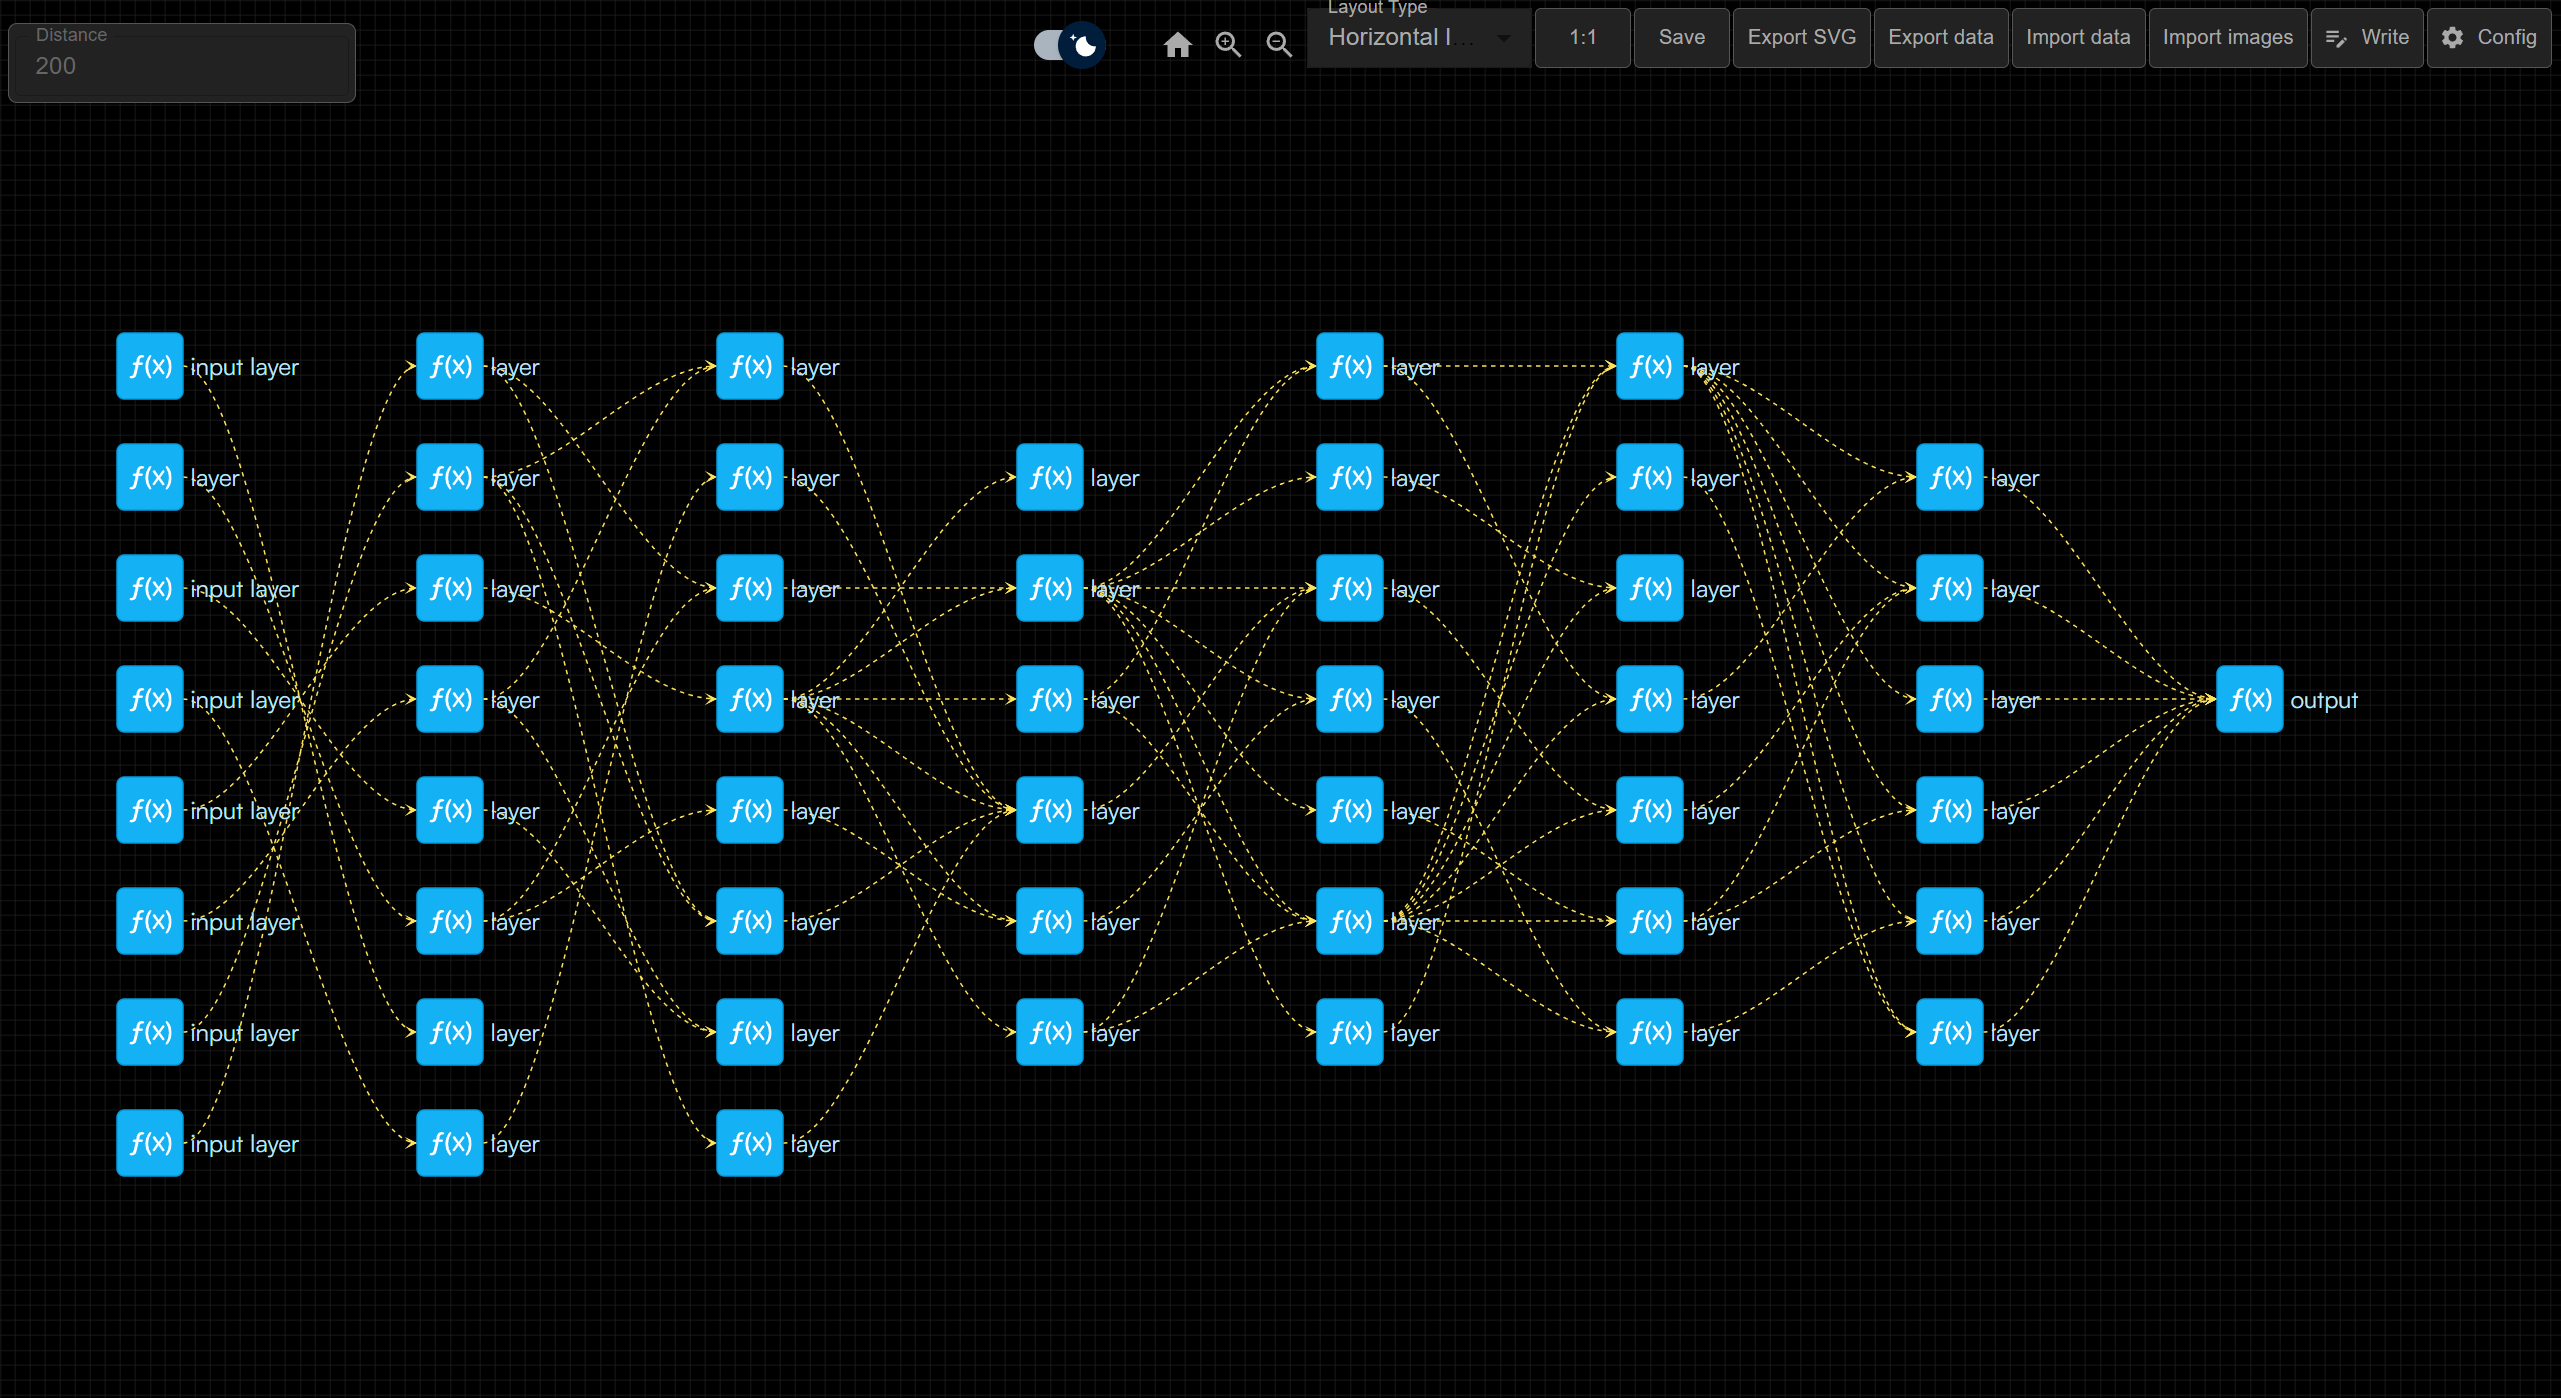
AddGraph is a very simple flowchart drawing tool. Compared with other flowchart tools, AddGraph is faster in adding nodes and lines. Nodes can be resized, icons can be customized, icon colors, border colors, and title colors can be changed. Lines can also be set to straight lines, dashed lines, and broken lines. Of course, the color and line width can also be changed. You can also set titles for lines, and of course you can set arrows for lines.
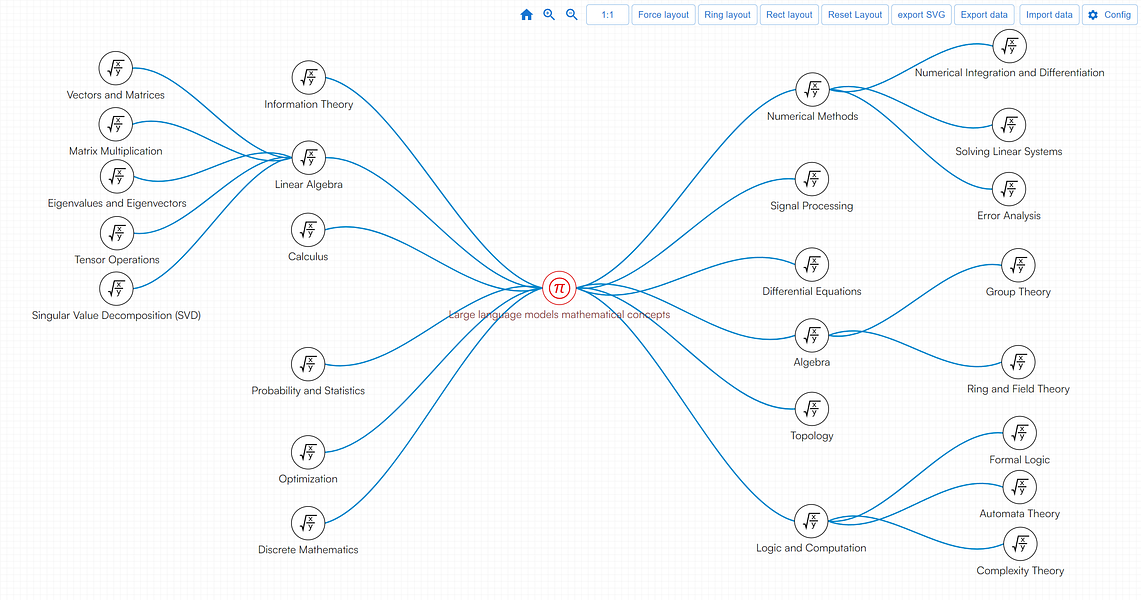
AddGraph can also be used as a data visualization tool. Currently, it provides three different layout methods: forece layout, circular layout, and rectangular layout.


